

ZingChart : Dynamic Data Visualization Software Solution
ZingChart: in summary
ZingChart empowers developers and data enthusiasts with comprehensive data visualization capabilities. Ideal for industries requiring dynamic graphical representations, it stands out for its vast data input compatibility, real-time updating features, and extensive chart library.
What are the main features of ZingChart?
Flexible Data Input
ZingChart is designed to handle a diverse range of data sources, providing seamless integration into your projects. Whether connecting with large datasets or handling streaming data, ZingChart ensures your data is visualized without hassle.
- Integrate with JSON, XML, or CSV data formats
- Supports real-time data feeds for dynamic charts
- Compatible with custom and third-party data sources
Extensive Chart Library
Boasting one of the most comprehensive chart collections, ZingChart provides visualizations to suit any data story. Whether simple or complex, there is a style that fits your project needs perfectly.
- Over 30 chart types including bar, line, pie, and scatter
- Customization options to modify chart appearance
- 3D rendering capabilities for enhanced visual impact
Real-Time Updating
Stay ahead with ZingChart’s real-time updating features, allowing instant visualization updates as data changes. This is crucial for industries needing constant data monitoring and instant insights.
- Automatic chart refresh without page reloads
- Responsive to live data changes
- Ideal for dashboards and interactive reports
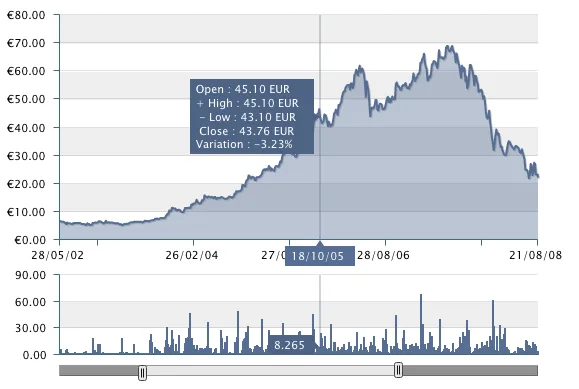
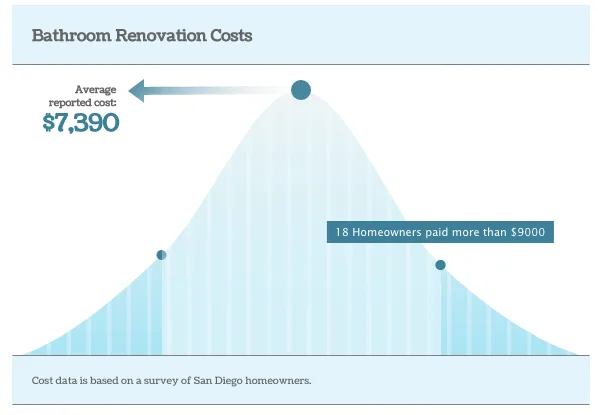
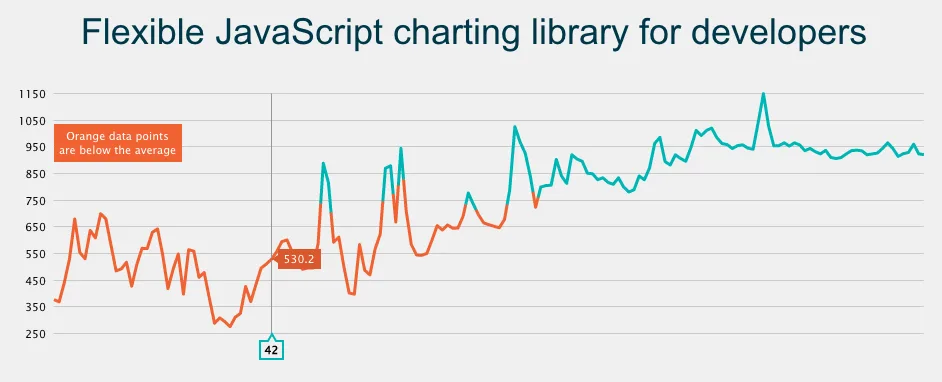
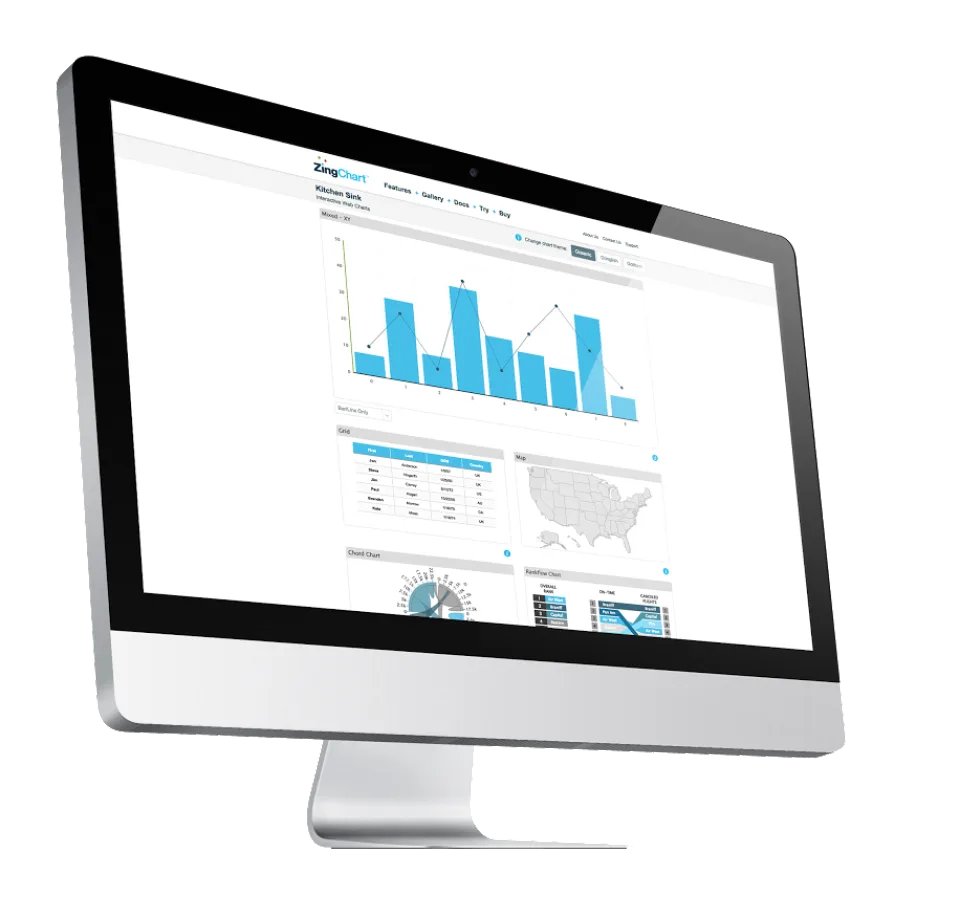
Screenshots
ZingChart: its rates
standard
Rate
On demand
Customer reviews about ZingChart
Appvizer calculates this overall rating to make your search for the best software easier. We've based it on user-generated verified reviews on industry-leading websites.